


Overview

ENPHAROS TP is a TP monitor-based performance management solution for C applications, which monitors the operation of TP-monitor that controls the processing of large-capacity transaction processing as well as C programs run by TP.
As C application performance monitoring by TP-monitor located at the center of the legacy system should be executed with integrity and reliability, ENPHAROS TP uses Dabom Soft’s proprietary LD_PRELOAD-based DLI(Dynamic Library Instrumentation) method.
In addition, to minimize impact on TP monitor service speed, ENPHAROS TP automatically determines whether to collect performance data depending on processing time, collecting such data only when a failure takes place or performance has slowed. When service queuing occurs, it analyzes the queuing trend, the TP server where the queuing occurred, and TP services that were executed at the time of the queuing.
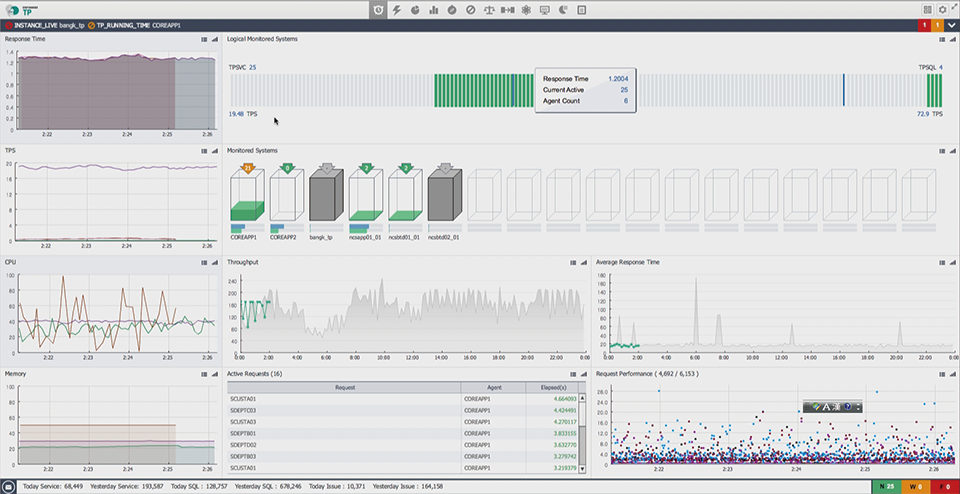
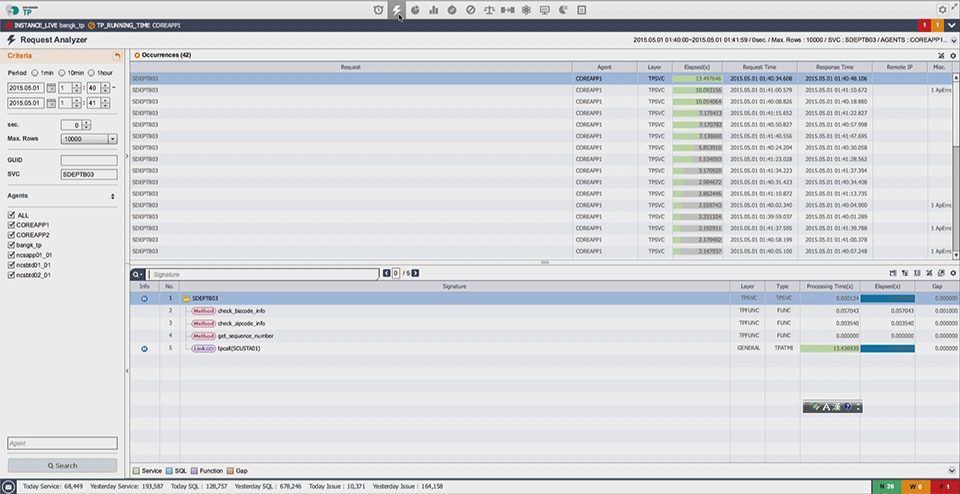
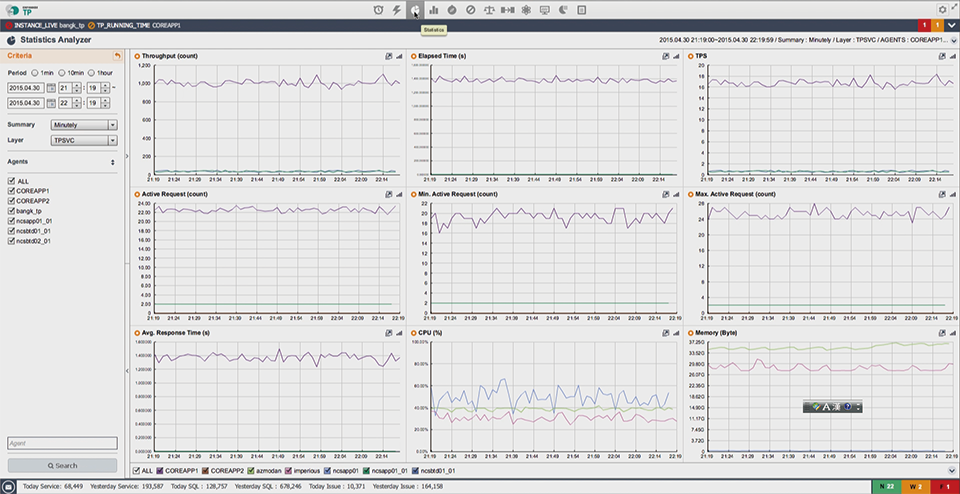
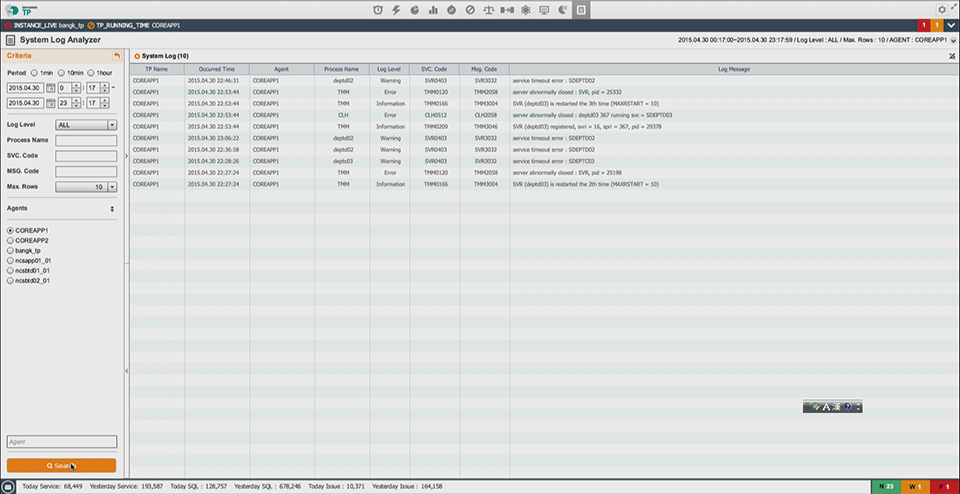
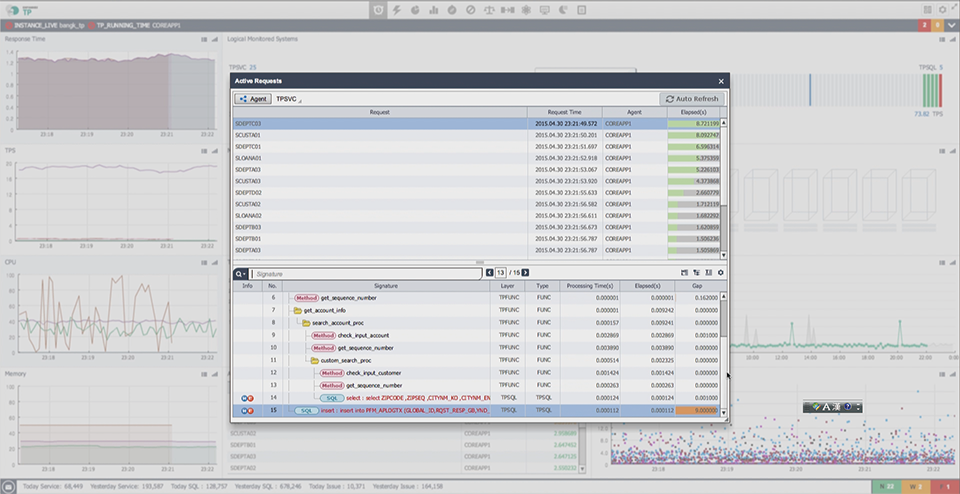
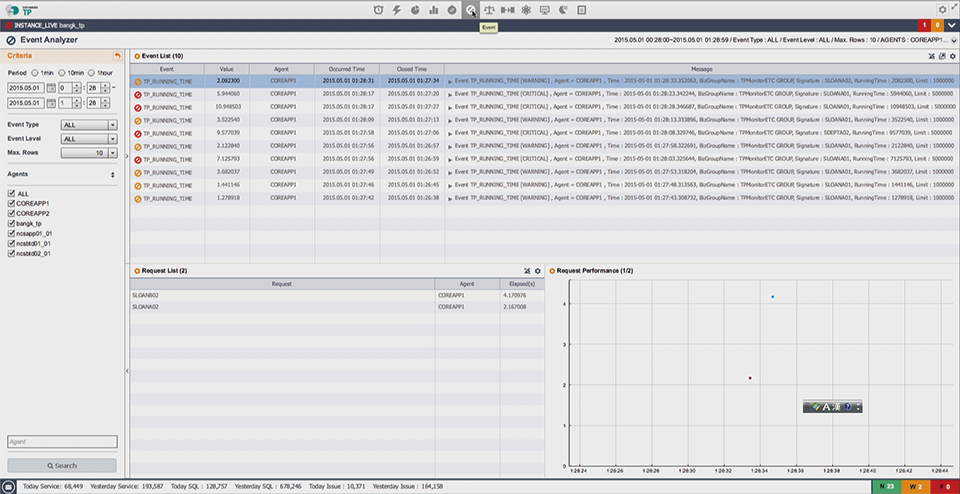
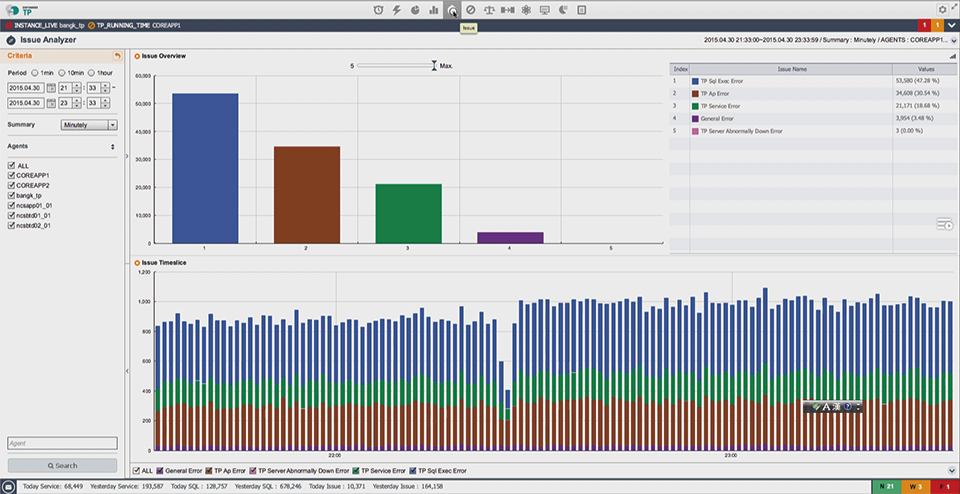
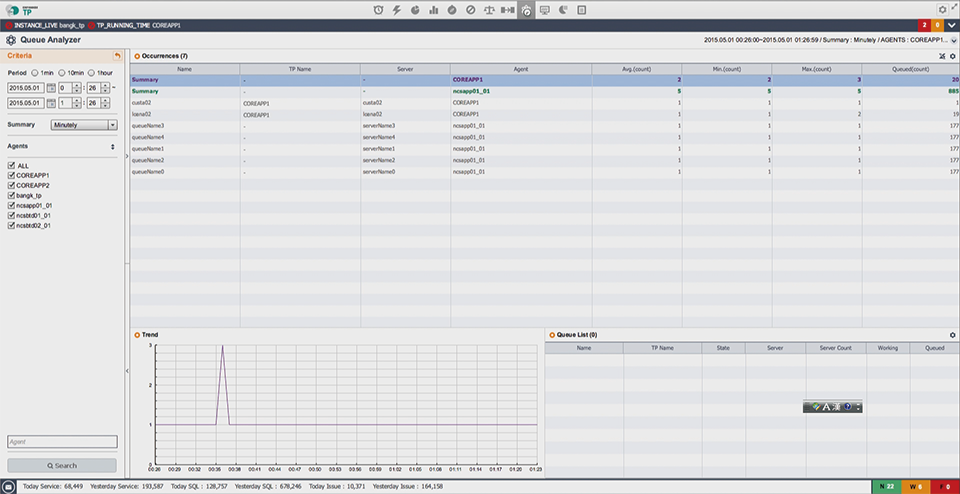
[The main screenshots of ENPHAROS TP]
Architecture
The architecture of ENPHAROS TP was designed using DabomSoft’s proprietary LD_PRELOAD-based DLI(Dynamic Library Instrumentation) method in order to monitor the progress of internal program processing without having to modify applications. This is because the integrity and reliability of C applications are the most important in the monitoring of the performance of internal processing of C applications by TP-monitor located at the center of the legacy system.
In addition, to eliminate the impact on the speed of TP monitor service, ENPHAROS TP automatically determines whether to collect performance data depending on processing time and collects such data only when a failure takes place or performance has slowed. When service queuing occurs, it analyzes the queuing trend, the TP server where the queuing occurred, and TP services that were executed at the time of the queuing.
In addition, to eliminate the impact on the speed of TP monitor service, ENPHAROS TP automatically determines whether to collect performance data depending on processing time and collects such data only when a failure takes place or performance has slowed. When service queuing occurs, it analyzes the queuing trend, the TP server where the queuing occurred, and TP services that were executed at the time of the queuing.
Detailed Features

Real-time monitoring of targets for TP-monitor

Quickly detects and prevents failure of service

Powerful analysis and remedy suggestion

DLI method

Data collection without affecting the system
Benefits
Through performance management of TP monitor and C applications, businesses can expect the following benefits.
- Rapid application work processes thanks to ultra lightweight structure
- Continuous monitoring by collecting data without affecting the system
- Portability and integrity to apply to systems in use
Supported Specification
[ENPHAROS TP Server Requirements]
| Item | Requirement | ||
|---|---|---|---|
| OS | UNIX, Linux, MS Windows Family | ||
| Hardware | Processor | Intel | Dual Pentium® IV 2GHz and higher |
| AMD | Dual Athlon XP 2400+ and higher | ||
| RAM | More than 4096MB of memory space | ||
| Disk Space |
At least 100GB ( flexible , depending on the number of monitored )
|
||
| NIC | 100Mbps | ||
| OS | 32Bit, 64Bit | ||
| Display | Minimum 1024X768 resolution , 24bit color or higher | ||
| Software | JDK |
Version 1.7 or later required
|
|
| DBMS | Cassandra built-in support ( the default installation ) Oracle 9i, 10gR2, 11g support ( commercial DB support ) PostgreSQL support (commercial DB support ) |
||
[Agent Compatibility]
| Item | Requirement | |
|---|---|---|
| OS | UNIX(IBM AIX 5.x, 6.x, 7.x, HP-UX 10, 11, Solaris) Linux, MS Windows Family |
|
| TP | Tmax | Tmax 3.x, 4.x, 5.x |
| Tuxedo | Tuxedo 8~12g | |
[UI Requirements]
| Item | Requirements |
|---|---|
| Web Browser | Internet Explorer 7.0 and higher, Mozilla Firefox 17 and higher, Google Chrome, Safari 5.0 and higher, Opera 11 and higher |
| Viewer | JAdobe Flash Player 11.9 and higher(UI 4.1 and lower) Adobe Flash Player 14.0 and higher(UI 5.0 and higher) |